
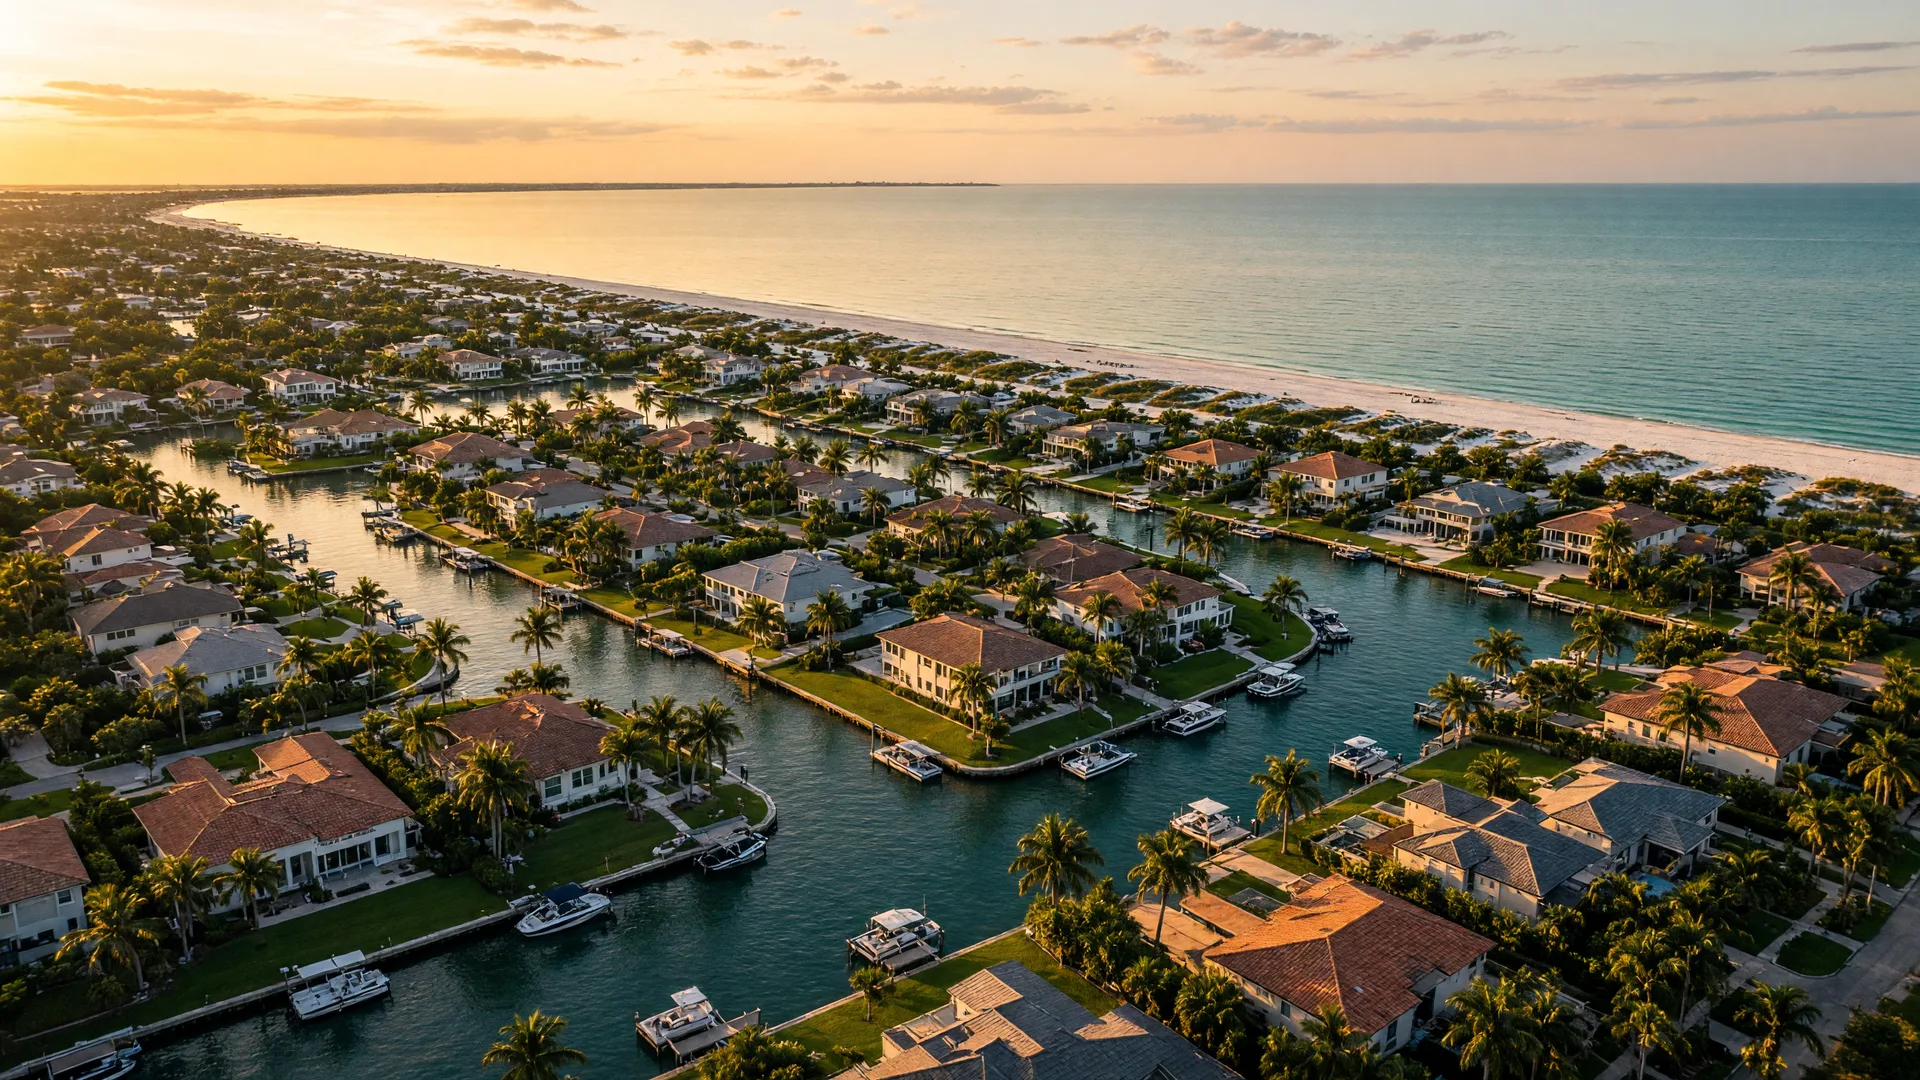
Weekly Single-Family Home Market Snapshot: October 26 - November 1, 2026
A single-family home market snapshot across 13 cities in Sarasota, Manatee, and Charlotte Counties for the week of October 26 through November 1, 2026. City-level figures are cross-checked across Realtor.com Research, Redfin Data Center, and the Zillow Home Value Index (ZHVI) where the sources publish them, with MLS-based local summaries shown and labeled where the three portals publish nothing. As of November 6, 2026, the portals still had not released city-level November figures, and most October city-level monthly data was not yet available, so each value below is the most recent month or point-in-time listing snapshot that source has published, and where a city has thin coverage, the gap is noted rather than estimated.
Written by Kim Donahue, REALTOR® with Medway Realty | 30+ Years of Real Estate Experience · Updated November 6, 2026
City-by-City Comparison
The table below compiles the most recent available single-family home data across the 13 cities in this survey. Official county-level RASM and Florida Realtors reports do not break out figures by individual city, so city-level figures come from the major real estate portals and MLS-fed listing trackers, with months of supply filled in at the county level where the city figure is not published. Because each source uses its own methodology and geography, figures are not always directly comparable across columns, and none of the sources publishes a consistent month-over-month trend series at the city level, so month-over-month moves are noted in the text below where a verified reading exists rather than added as a separate column. Where a metric is marked N/A, none of the sources checked published a reliable single-family figure for that city in the current period, and it was omitted rather than estimated.
| City | County | Median List Price | Median Sale Price | Active Inventory (SFH) | Median DOM | New Listings | Price Trend (YoY) | Months Supply |
|---|---|---|---|---|---|---|---|---|
| Sarasota | Sarasota | no clean city SF median published ~$850K median list on ~328 new listings (Redfin city new-listings page, current, all types, ~142 DOM) | ~$607K city (Redfin, all types, 3-mo ending Sep, +32.0%, high-end mix) $485,000 county SF (RASM year-end 2025 series, Dec 2025 read; full-year median $474,700, -6.0% YoY) ~$410K ZHVI city (Zillow, 8/31, -2.7%) | no city count published this run | ~93 city, all types (Redfin, 3-mo ending Sep) ~47 days to contract county SF (RASM, mid-2026) | ~328 (Redfin city new-listings page, current, all types) | +32.0% (Redfin city, luxury mix) -2.7% (Zillow ZHVI) county SF -6.0% (RASM, full-year 2025) | ~3.7 county SF (RASM, mid-2026) |
| Lakewood Ranch | Manatee | ~$660,972 (Movoto, current) ~$600K single-story segment (Redfin) | ~$630K (Redfin city, 3-mo ending Jun, +6.7% YoY; neighborhood read ~$627,500, +6.4%, dated) $583,858 ZHVI (Zillow, 7/31, -4.8%) | ~1,028 to ~1,541 active, scope varies (Movoto, July) 218-586 (brokerage reads, divergent) | ~43 (Redfin, down from ~72 a year earlier) ~46 days to pending (Zillow) | ~116 (Movoto, July) | +6.4-6.7% (Redfin city, dated) -4.8% (Zillow ZHVI), divergence shown | ~0.99 (Houzeo) to ~3.5-5 (brokerage), divergent |
| Bradenton | Manatee | ~$353K (Realtor.com via aggregator, Aug 2026) $410K (MyBrokerOne, Oct, all types) | ~$313K (Redfin city, all types, 3-mo ending Aug, -2.2%) $321,847 (Redfin, Sep, -2.5%) ~$365K avg last month, +8.3% | no clean city SF count published | ~64 city, all types (Redfin, vs ~69 a year earlier) 89 (Realtor.com, ZIP 34205, May, dated) | ~120 in 7 days to Sep 5 (Team Renick, SF plus condo, dated) | -2.2% (Redfin, 3-mo ending Aug) -2.5% (Redfin, Sep) | ~4.1 county SF (Manatee, June 2026, dated) |
| Anna Maria | Manatee | ~$2,985,000 on 66 city homes (MLS-fed snapshot, 9/12) ~$2.95M avg list on 57 (Movoto, Oct) | ~$1.6M last month, -7.1% YoY (Redfin city, all types) $1,895,816 typical city value (Zillow, 6/30, -7.5%) $1,918,808 value 34216 (Zillow, 9/30, +0.7%), divergence shown | 66 city homes, SF plus condo (9/12) 57 (Movoto, Oct) | 146 (9/12 snapshot) ~111-184 typical (Redfin) | ~11 that week (9/12 snapshot) 3 active new listings at $2.94M median list (Redfin, current) | -7.1% (Redfin, small sample) -7.5% (Zillow city) vs +0.7% (Zillow 34216) | ~10.7 (late Aug, third-party) or ~7.3 (July), both labeled |
| Palmetto | Manatee | $417,000 (Realtor.com ZIP 34221, May, -2.0% YoY, dated) ~$344K city (Redfin, Nov 2025 vintage, dated) | ~$344K city (Redfin, Nov 2025, +1.0% YoY, dated) $418,301 (Redfin, Sep, +12.3%, all types) $350,285 ZHVI (Zillow, 8/31, -3.4%) | 481 (Realtor.com ZIP 34221, +1.0% YoY, dated) | 69 (Realtor.com ZIP 34221, +18% YoY, dated) ~103 (Redfin city, dated) | n/a this run | +12.3% (Redfin, Sep) -3.4% (Zillow ZHVI) | ~3.8 (July 2026, third-party, SF plus condo) |
| Parrish | Manatee | ~$450,000 (Realtor.com via aggregator, Dec 2025, flat YoY, dated) $424,984 on ~706 SFH listings (Sept 2026 listing feed) | ~$405K (Redfin ZIP 34219, 3-mo ending Jun, +3.0%, dated) ~$407K (Redfin, Sep, +$2K MoM) | ~706 SFH (Sept 2026 listing feed) 538 (Realtor.com via aggregator, Dec 2025, -17% YoY, dated) | 58 (Sept 2026 listing feed) ~71 (Redfin, 3-mo) / ~73 (Sep) | 112 that week (Sept 2026 listing feed) | +3.0% (Redfin, dated window) -7.7% (Zillow, Dec 2025, dated) | ~3.4 (July 2026 broker read, labeled) |
| Ellenton | Manatee | $472K (Movoto) $279,250 on ~100 active (Momentum, 9/12) $283,500 (RealtyTrac, Sep, +11.2%, manufactured-home share pulls list down) | ~$450K (Redfin ZIP 34222, 3-mo ending Aug, +28.2%, mix-shifted) $426,300 (RealtyTrac, Sep, +6.9%) | ~399 (RealtyTrac, Sep, +54% YoY) ~100-128 active (Momentum 9/12, Movoto) | 75 (Redfin, vs 60 a year earlier) 52 (Momentum, 9/12) ~100 (Movoto, vs 74 a year earlier) | 17 in week ending 9/12 (Momentum) 3 (Movoto) | +28.2% (Redfin 34222, mix-shifted) +6.9% (RealtyTrac, Sep) | 5.7 (Momentum scorecard, rated balanced) |
| Osprey | Sarasota | ~$735,999 (Zillow ZIP 34229, active listings, current) ~$792K (2026 guide, April, dated) | $610,400 (RealtyTrac ZIP 34229, Oct 2026 vs Oct 2025, -12.61%) $647,192 (Redfin city, Sep, -0.43%) $710K (Redfin ZIP 34229, -5.3%) $661,421 ZHVI (Zillow, 9/30, -1.0%) | 390 homes (RealtyTrac ZIP 34229, current) | ~85 (2026 guide) ~75 (Redfin, mid-2025, dated) | no current figure; ~10 (Movoto, June 2025, dated) | -12.61% (RealtyTrac, Oct) -0.43% (Redfin city, Sep) -1.0% (Zillow ZHVI) | n/a this run |
| Nokomis | Sarasota | ~$547,000 (Movoto ZIP 34275, 11/4) $549,500 (RealtyTrac, Sep, -7.65% YoY) $539,940 (homevaluepros, Sep, +1.9% MoM) | $545,830 (Movoto ZIP 34275, 11/4, -0.7% YoY) $511,500 (RealtyTrac, Sep, -2.09%) $508K (Redfin ZIP 34275, 3-mo ending Jun, -2.6%, dated) $501,628 ZHVI (Zillow, 9/30, -2.2%) | ~610-615 (Movoto ZIP 34275, 11/4, +7.8% YoY) 1,141 (RealtyTrac, Sep, +41.4% YoY, broader area) 179 (homevaluepros, Sep) | ~164-166 (Movoto, 11/4, up from ~112 a year earlier) 74 (homevaluepros, Sep, -20.4% MoM) ~49 days to pending (Zillow, 9/30) | 84 (homevaluepros, Sep) ~35 (Movoto, June, dated) | -0.7% (Movoto, 11/4) -2.2% (Zillow ZHVI) list -7.65%, sold -2.09% (RealtyTrac, Sep) | ~4.6 (Homes.com) to ~7.5 (Houzeo), divergent |
| Venice | Sarasota | $420,750 (Realtor.com via homevaluepros, July, dated) ~$460K (Movoto, Oct, 0% MoM, +4% YoY) | ~$420K city, all types (Redfin, Sep, +4.2%, ~$405K avg last month) $460K (Movoto, Oct) $479K SFH (VeniceAgent, SF-only read) $332,500 ZIP 34285 (Momentum, 10/14, -7.1% YoY) | 1,387 (Movoto, 10/16) / 1,439 (Movoto, Oct) 777 (Realtor.com, July, dated) 430 active SFH (VeniceAgent, most recent published read) | ~91 (Redfin, Sep, vs 116 a year earlier) ~120 avg (Movoto, 10/16) 81 (Realtor.com, July, dated) | 194 (Realtor.com, July, dated) 100 (Movoto, 10/16) | +4.2% (Redfin, Sep) +4% list YoY (Movoto, Oct) -7.1% ZIP 34285 (Momentum, 10/14) | ~3.4 SFH (VeniceAgent, published read) ~3.5 (HomesByMarco, 10/30) |
| Englewood | Sarasota / Charlotte | $426K 34223 (+0.84% YoY, RealtyTrac, Sep) $325K 34224 (-1.5% YoY, RealtyTrac, Sep) ~$394K on ~97 new listings (Redfin, current) | $487,268 city (Redfin, 3-mo ending Sep, +28.9%, flagged) $396,600 34223 (+8.07%, RealtyTrac, Sep) $265,500 34224 (-10.1%, RealtyTrac, Sep) $372,084 ZHVI 34223 (Zillow, 8/31, -8.3%) | 942 34223 (+13.6% YoY) 788 34224 (+21.8% YoY) | ~86 city (Redfin, Sep, vs ~81 a year earlier) 67-91 per ZIP (Redfin) | ~97 (Redfin, current) 197 pending at ~$345K median list | +28.9% (Redfin city, flagged) +8.07% 34223 / -10.1% 34224 (RealtyTrac, Sep) | n/a citywide this run |
| Port Charlotte | Charlotte | $337,950 (Realtor.com, July, dated) $455-460K ZIP 33981 (RealtyTrac, Oct, +1.1% YoY) | ~$276K SF (Redfin city, 3-mo ending Aug, +0.3%) $378,100 ZIP 33981 (RealtyTrac, Oct, -4.8% YoY) $268,990 ZHVI (Zillow, 7/31, -6.2%) $301,052 ZHVI 33954 (Zillow, 9/30, -1.6%) | 1,184 (Realtor.com, July, dated) 885 ZIP 33981 (RealtyTrac, Oct) | ~74 (Redfin, Aug, vs 86 a year earlier) 83 (Realtor.com, July, dated) | 290 (Realtor.com, July, dated) | +0.3% (Redfin, Aug) -4.8% (RealtyTrac ZIP 33981, Oct) -6.2% (Zillow ZHVI) | n/a citywide this run |
| Boca Grande | Lee | ~$3.98M (Movoto, Oct, 22 homes) $3,495,000 (MyBrokerOne, Oct, MLS) $1,375,000 all types (LTR Homes, Oct, Stellar MLS) | $3.7M (Redfin ZIP 33921, 3-mo ending Sep, +33.9% on 13 homes, thin) $2,375,000 (MyBrokerOne, Oct, 84 sold) $2,241,705 ZHVI (Zillow, 7/31, -9.7%) | 45 (MyBrokerOne, Oct) 22 (Movoto, Oct) 23-26 all types (LTR Homes, Oct) | 55 median (Redfin, 3-mo) 132 avg (MyBrokerOne, Oct) 235 avg (Movoto, Oct) 217 avg (LTR Homes, Oct) | n/a this run | +33.9% (Redfin, thin volume) -9.7% (Zillow ZHVI) | n/a this run |
Notes: As of November 6, 2026, none of the three named portals had published city-level November figures, and most October city-level monthly figures were not yet available, so each value is that source's most recent published month or a point-in-time listing snapshot (June through October 2026, with vintage labels throughout). Redfin city figures cover all residential property types unless labeled. Zillow figures are ZHVI (Zillow Home Value Index), a modeled estimate, not actual sale prices. The weekly county pulse comes from Team Renick's published Stellar MLS summaries for the week of October 25 through 31, 2026, the closest published weekly window to this snapshot's October 26 through November 1 period. "MLS-fed," "MLS-based," "third-party," and "tracker" refer to products powered by MLS feeds or third-party aggregators (Team Renick, VeniceAgent, Momentum Realty, Movoto, RealtyTrac on Realtor.com-sourced data, Resideline, Orchard, Homes.com, homevaluepros, MyBrokerOne, LTR Homes, and HomesByMarco) used for list price, inventory, days on market, and listing-age counts where the named portals publish no city figure. "N/A" means the metric was not reliably published at the city level by any of the sources checked for the current period, and it was omitted rather than estimated.
Movers of the Week
A few cities show notable shifts in the data reviewed this week. Because the portals have not yet published city-level November figures and most October monthly readings are still pending, these items reflect the freshest verified monthly, ZIP-level, or point-in-time readings, so they describe recent direction rather than a single week's move. The weekly county pulse for October 25 through 31, 2026, from Team Renick's Stellar MLS summaries (published November 1), sits beneath the table: Sarasota County logged 284 new listings, 209 pending, 220 closed sales, and a $449,995 median sold price with sellers capturing 92.6 percent of list price, and Manatee County logged 243 new listings, 180 pending, 233 closed sales, and a $440,000 median with sellers capturing 94.3 percent.
Nokomis days on market are the highest in this survey, up about 50 days year over year
Movoto's November 4 read for ZIP 34275 shows a median 164 to 166 days on market, up from about 112 a year earlier, with 610 to 615 active listings, up 7.8 percent year over year, and a median sold price of $545,830, down 0.7 percent. RealtyTrac's September ZIP read shows a broader for-sale count of 1,141, up 41.4 percent. The days-on-market swing is the sharpest in the 13-city table this run, and it lines up with list prices easing 7.65 percent year over year on the RealtyTrac series.
Osprey's October median sale is down more than 12 percent year over year on the ZIP read
RealtyTrac's ZIP 34229 page, comparing October 2026 with October 2025, shows a median sale price of $610,400, down 12.61 percent, with 390 homes currently listed. Redfin's city page reads more mildly, a $647,192 median for three months ending September, down 0.43 percent, and Zillow's average value of $661,421 is down 1.0 percent as of September 30. The three readings are not the same window or mix, so they are shown rather than averaged, and the October ZIP figure is the clearest price signal among them.
Englewood's two ZIPs are moving in opposite directions
RealtyTrac's September data splits the city: ZIP 34223 (Sarasota County) shows a median sold price of $396,600, up 8.07 percent year over year, with 942 homes for sale, up 13.6 percent, while ZIP 34224 (Charlotte County) shows $265,500, down 10.1 percent, with 788 homes for sale, up 21.8 percent. Redfin's city-wide median of $487,268 for three months ending September, up 28.9 percent, is flagged as a small-window mix reading. A buyer or seller in Englewood needs the ZIP, not the city figure, which is exactly why the divergence is shown.
Venice remains the tightest single-family market in the survey
VeniceAgent's single-family series reads 430 active single-family listings at a $479,000 median with about 3.4 months of supply, and HomesByMarco's October 30 absorption report puts Venice at about 3.5 months, balanced. Movoto's October page shows list prices up 4 percent year over year and flat month over month, while Momentum's October 14 ZIP 34285 read shows a median sale of $332,500, down 7.1 percent. Supply stays the tightest of any city in the table even as ZIP-level sale medians sit below the city median, a gap worth reading one neighborhood at a time.
Parrish is still drawing the heaviest single-week new-listing flow in the survey
The most recent verified listing feed for ZIP 34219, from September 2026, shows about 706 single-family listings at a $424,984 median list price with 58 median days on market and 112 new listings in that week, the single heaviest weekly inflow in the 13-city table. Redfin's ZIP median of about $407,000 for September is up about $2,000 month over month on its widget, so the new supply is churning rather than piling up, but the flow itself is the largest in this survey.
Regional Trend: One Market or Several?
The region is moving together at the weekly level even as the city data diverges underneath it. Team Renick's Stellar MLS pulse for October 25 through 31, 2026 shows both counties in a similar posture: Sarasota County logged 284 new listings, 209 pending, and 220 closed sales at a $449,995 median with 92.6 percent of list price captured, and Manatee County logged 243 new listings, 180 pending, and 233 closed sales at a $440,000 median with 94.3 percent captured. Both medians sit in the mid-$440,000s, both counties are closing more homes than they are adding to the pending pile, and neither shows the list-price discounting that defined the summer. The county-level orientation is stable as well: RASM's mid-2026 county single-family data used in this run shows roughly 47 days to contract and about 3.7 months of supply for Sarasota County, its full-year 2025 median was $474,700 at $485,000 for December 2025, and a June 2026 third-party read put Manatee County single-family supply near 4.1 months. Under that shared frame, the 13 cities split the way they have for weeks: Nokomis is the outlier on the slow side with 164 to 166 days on market and list prices down 7.65 percent year over year, Venice holds the tightest single-family supply at about 3.4 to 3.5 months, Englewood's two ZIPs move in opposite directions, Parrish keeps drawing the heaviest single-week new-listing flow in the survey, and the islands, Anna Maria and Boca Grande, remain on volume too thin for any portal to publish a stable monthly median. In short, the region is not diverging this week: it is consolidating around firm, flat prices with the local differences showing up in days on market and ZIP-level mix rather than in a shared direction of travel.
Data Gaps and Limitations
November data lag: As of November 6, 2026, none of the three named portals had published city-level November figures, and city-level October data was still uneven. Redfin's city and ZIP pages carried June-through-October as-of labels, Zillow's latest update dates ran from June 30 to September 30, 2026, and Realtor.com's most current city-level data surfaced through third-party aggregators dated July through October 2026. The freshest county releases verified in research this run were RASM's year-end 2025 report and its mid-2026 county single-family reads, plus Team Renick's weekly Stellar MLS summaries published November 1, 2026, for the week of October 25 through 31, 2026. RASM's Q3 2026 report, released October 16, 2026, and Charlotte County's September 2026 summary from Time Realty were referenced by other sources but their figures were not re-verified directly this run, so county cells lean on the freshest figures this run could verify. Each value above is the most recent month that source has released or a point-in-time listing snapshot, and no November figure was estimated or interpolated.
Weekly window: None of the three portals publishes weekly city-level single-family data. The county pulse comes from Team Renick's weekly Stellar MLS summaries for October 25 through 31, 2026, published November 1, 2026, which is the closest published weekly window to this snapshot's October 26 through November 1 period and covers all property types; Sarasota County's weekly median sold price ($449,995) and Manatee County's ($440,000) are both published in these summaries.
Sarasota: No city-level median list price or active single-family inventory from the named portals this run. The city sale-side figures verified are Redfin's all-types $607,000 median for three months ending September (up 32.0 percent, high-end mix), Zillow's city average home value of $409,878 as of August 31 (down 2.7 percent), and RASM's year-end series (county single-family full-year 2025 median $474,700, down 6.0 percent; December 2025 read $485,000; mid-2026 county single-family about 47 days to contract and about 3.7 months of supply). The weekly new-listings count (284) is county-wide from Team Renick for October 25 through 31. Sources checked: Redfin, Zillow, RASM year-end 2025 report, Realtor.com county feed via Herald-Tribune data (April 2026, dated), Team Renick weekly summary.
Lakewood Ranch: Redfin's city page still shows a mid-2026 window (three months ending June 2026) and Zillow's July 31, 2026 update, so neither reflects October. Realtor.com Research surfaced no Lakewood Ranch page this run; Movoto's current read (median list about $660,972, about 116 new listings, inventory that ranges roughly 1,028 to 1,541 depending on scope) and a brokerage months-of-supply span of roughly 3.5 to 5 months versus Houzeo's 0.99 months are shown with their divergence rather than averaged. Sources checked: Redfin (city), Zillow, Movoto, Houzeo, brokerage market reports.
Bradenton: The named portals report all home types and publish no city-level months of supply or single-family-specific active count. Verified this run: Redfin city median sale $313,000 for three months ending August (down 2.2 percent) and $321,847 for September (down 2.5 percent) at about 64 days on market; Realtor.com-derived median list about $353,000 (August snapshot); a live-MLS tracker showing about 120 new listings in the 7 days to September 5, 2026, all types (dated); and Manatee County single-family months of supply about 4.1 months (June 2026, dated). Sources checked: Redfin, Realtor.com via aggregator, Team Renick live-MLS tracker, Zillow via third party.
Anna Maria: The city's volume is too thin for any portal to maintain a stable monthly single-family median, and none of the three portals publishes a clean single-family-only breakout for this market. Verified this run: Redfin city median sale about $1.6 million for last month (down 7.1 percent year over year, all types), Zillow's city average value of $1,895,816 as of June 30 (down 7.5 percent) versus its ZIP 34216 value of $1,918,808 as of September 30 (up 0.7 percent), and a September 12 MLS-fed snapshot of 66 city homes at a median list near $2,985,000 with about 146 days on market and about 11 new listings that week. Months-of-supply estimates (about 10.7 months late August, about 7.3 months July) are third-party and labeled with their vintages. Sources checked: Redfin, Zillow, Momentum, Movoto.
Palmetto: Portal coverage is thin and dated this run: Redfin's city page reads a November 2025-vintage median of about $344,000 (up 1.0 percent, about 103 days), Zillow's city value of $350,285 is dated August 31 (down 3.4 percent), and Realtor.com-derived ZIP 34221 data (median list $417,000, 481 active, 69 days on market) is dated May 2026. Redfin's freshest published city median is $418,301 for September, up 12.3 percent, all home types. No current portal new-listings count was published this run. Months of supply (about 3.8, July 2026) is a third-party read on single-family plus condo inventory. Sources checked: Redfin, Zillow, Realtor.com via aggregator, Movoto.
Parrish: The freshest verified figures this run are Redfin's ZIP 34219 median of about $407,000 for September (about $2,000 above its June-quarter median of $405,000, up 3.0 percent year over year on that dated window) at about 71 to 73 days on market, a September 2026 listing feed of about 706 single-family listings at a $424,984 median list with 58 median days on market and 112 new listings that week, and a Realtor.com-derived read from December 2025 (median list about $450,000, 538 active, down 17 percent year over year, dated). Months of supply (about 3.4 months) is a July 2026 broker read and labeled with its vintage. Sources checked: Redfin (ZIP), Realtor.com via aggregator, a September 2026 listing feed, Zillow via third party.
Ellenton: Realtor.com has no Ellenton city page, and the market carries a large manufactured-home share, so list medians sit far below sale medians and are labeled as such. Verified this run: Redfin's ZIP 34222 median sale $450,000 for three months ending August (up 28.2 percent, flagged as mix-shifted) at 75 average days; RealtyTrac's September read (median list $283,500, up 11.2 percent; median sold $426,300, up 6.9 percent; about 399 homes for sale, up 54 percent; 63 sold, down 31.5 percent); and Movoto (median list $472,000, 128 active, about 100 days on market). Momentum's September 12 scorecard shows about 100 active listings at a $279,250 median list, a 52-day median, 17 new listings that week, and 5.7 months of supply. Sources checked: Redfin (ZIP), RealtyTrac, Movoto, Momentum.
Osprey: Portal coverage is mixed and dated; no portal publishes a current months-of-supply figure for Osprey. Verified this run: RealtyTrac ZIP 34229 comparing October 2026 with October 2025 shows a median sale of $610,400, down 12.61 percent, with 390 homes currently listed; Redfin's city page reads $647,192 for three months ending September (down 0.43 percent) and its 34229 page shows a $710,000 median for last month (down 5.3 percent) on a cached read; Zillow's city average value of $661,421 is dated September 30 (down 1.0 percent), and its ZIP 34229 active listings run about a $735,999 median. No current new-listings count was found this run; the count in the table is labeled as dated. Sources checked: Redfin (city and ZIP), RealtyTrac, Zillow, Movoto (dated).
Nokomis: No portal publishes a single-family-only breakout, and the sources disagree by scope and vintage. Verified this run: Movoto's November 4, 2026 ZIP 34275 read (median list about $547,000, median sale $545,830, down 0.7 percent year over year, 610 to 615 active listings, up 7.8 percent, 164 to 166 median days on market, up from about 112 a year earlier); RealtyTrac's September read (median list $549,500, down 7.65 percent; median sold $511,500, down 2.09 percent; 1,141 homes for sale, up 41.4 percent, broader area); homevaluepros' September ZIP read (179 homes, median list $539,940, up 1.9 percent month over month, 74 median days, down 20.4 percent from August); and Zillow's typical value of $501,628, dated September 30, down 2.2 percent. Months-of-supply estimates range from about 4.6 (Homes.com) to about 7.5 (Houzeo) and are shown as divergent. Sources checked: Redfin, RealtyTrac, homevaluepros, Zillow, Movoto, Homes.com, Houzeo.
Venice: No single source publishes all Venice metrics for the same window. Verified this run: VeniceAgent's single-family read (the only SF-only series found, 430 active listings, a $479,000 median, about 3.4 months of supply) with HomesByMarco's October 30 absorption report at about 3.5 months; Redfin's city page (September 2026, all home types) at $419,800, up 4.2 percent, about 91 days on market; Realtor.com-derived data via homevaluepros (July 2026: 777 homes for sale, 194 new listings, median list $420,750, 81 days, dated); and Movoto's Realtor.com-sourced page updated October 16 and again in October (1,387 then 1,439 active, 100 new listings, median list about $460,000, up 4 percent year over year, flat month over month, about 112 to 120 days). Momentum's ZIP 34285 read of October 14 shows a $332,500 median sale, down 7.1 percent. Sources checked: VeniceAgent, HomeValuePros, Redfin, Movoto, Momentum, HomesByMarco.
Englewood: No clean single-family-only subset exists, and the city straddles the Sarasota and Charlotte county line. Verified this run: Redfin's city median $487,268 for three months ending September, up 28.9 percent, flagged as a small-window mix reading, at about 86 days; RealtyTrac's September ZIP reads (34223: median list $426,000, up 0.84 percent, median sold $396,600, up 8.07 percent, 942 homes for sale, up 13.6 percent; 34224: median list $325,000, down 1.5 percent, median sold $265,500, down 10.1 percent, 788 homes for sale, up 21.8 percent); Redfin's current new-listings page showing about 97 new listings at about a $394,000 median list; and Zillow's 34223 average value of $372,084, dated August 31, down 8.3 percent. No current citywide months-of-supply figure was published by the named portals. Sources checked: Redfin, RealtyTrac, Zillow.
Port Charlotte: Portal data is dated and the city spans multiple ZIPs. Verified this run: Redfin's city page for three months ending August reads a median single-family sale near $276,000, up 0.3 percent, at about 74 days; Zillow's average value of $268,990 is dated July 31 (down 6.2 percent), with ZIP 33954 at $301,052 as of September 30 (down 1.6 percent); Realtor.com-derived July figures (1,184 active, 290 new listings, $337,950 median list) are labeled dated; and RealtyTrac's ZIP 33981 read comparing October 2026 with October 2025 shows a median list of $455,000 to $460,000 (up 1.1 percent) and a median sold of $378,100 (down 4.8 percent) on 885 homes for sale. No current citywide months-of-supply figure was published this run. Sources checked: Redfin, Zillow, Realtor.com via aggregator, RealtyTrac.
Boca Grande: Sales volume in ZIP 33921 is thin and seasonal, so medians swing widely, and Realtor.com Research published no ZIP 33921 market statistics this run. The two current October MLS-fed trackers diverge on scope: MyBrokerOne shows a $3,495,000 median list, a $2,375,000 median sale on 84 sold, 45 active, and 132 average days, while Movoto shows a $3.98 million median list on 22 homes at about 235 average days, and LTR Homes' Stellar read (all property types, October) shows 23 to 26 actives at a $1,375,000 median list. The named portals are dated: Redfin's $3.7 million median is for three months ending September on 13 sales, up 33.9 percent, and Zillow's average value of $2,241,705 is dated July 31, down 9.7 percent. No months-of-supply figure was published for this market this run. Sources checked: Redfin, Zillow, MyBrokerOne, Movoto, LTR Homes.
County and statewide context: Because official RASM and Florida Realtors county reports do not break out figures by city, city rows rely on the portals named in this study. The county anchors verified this run are RASM's year-end 2025 report (Sarasota County single-family full-year median $474,700, down 6.0 percent; December 2025 read $485,000), RASM's mid-2026 county single-family reads (about 47 days to contract, about 3.7 months of supply), a June 2026 third-party read putting Manatee County single-family supply near 4.1 months, and Team Renick's weekly Stellar MLS summaries for October 25 through 31, 2026. RASM's Q3 2026 report and Charlotte County's September 2026 summary from Time Realty were identified in research but their specific figures were not re-verified directly on this run, so they are not carried into the table; the weekly pulse and dated portal vintages carry the report instead.
City-wide limitations: Across all cities, "median list price," "active single-family inventory," "new listings," and "months of supply" remain the figures most likely to be unpublished or inconsistent at the city level on Realtor.com, Redfin, and Zillow, because those portals commonly report at the county, ZIP, or all-property-type level instead. Where a metric is marked N/A, none of the sources checked published a reliable single-family figure for that city in the current period, and it was omitted rather than estimated.
Principal Sources Checked This Run
- Team Renick: Sarasota County market update, week of October 25-31, 2026
- Team Renick: Manatee County market update, week of October 25-31, 2026
- RASM: Year-End 2025 Real Estate Market Report (Sarasota/Manatee)
- Herald-Tribune / Realtor.com: Sarasota County real estate market report
- Redfin: Sarasota housing market
- Redfin: Bradenton housing market
- Redfin: Venice housing market
- Redfin: 34219 (Parrish) housing market
- Redfin: 34222 (Ellenton) housing market
- Redfin: 34229 (Osprey) housing market
- Redfin: 34275 (Nokomis) housing market
- Redfin: 33921 (Boca Grande) housing market
- Zillow: Lakewood Ranch home values
- Zillow: Palmetto home values
- Zillow: Nokomis 34275 home values
- Zillow: Englewood 34223 home values
- Zillow: Boca Grande 33921 home values
- RealtyTrac: Ellenton 34222 market trends
- RealtyTrac: Osprey 34229 market trends
- RealtyTrac: Nokomis 34275 market trends
- RealtyTrac: Englewood 34223 market trends
- RealtyTrac: Port Charlotte 33981 market trends
- VeniceAgent: Venice single-family market conditions
- HomesByMarco: Venice absorption report (October 30, 2026)
- Movoto: Venice market trends (updated October 16, 2026)
- Movoto: Ellenton market trends
- Movoto: Englewood market trends
- Movoto: Boca Grande homes for sale and market trends
- Momentum Realty: Anna Maria 34216 housing scorecard
- MyBrokerOne: Boca Grande market trends
- LTR Homes: Boca Grande market (Stellar MLS, October 2026)
- HomeValuePros: Nokomis 34275 housing market
- Homes.com: Nokomis homes for sale
- Houzeo: Nokomis housing market overview
If you would like a read on your own neighborhood or a specific price range, I can pull the local absorption picture and what it means for your timing. Send me a message or call (941) 724-2587.